
Your Partner in San Diego Coastal Living
&
Real Estate Investment
Building Community with Every Client Connection

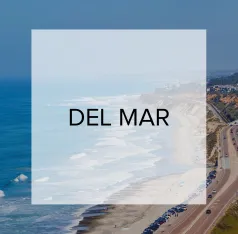
I understand that you're not just finding a house – you're discovering a community that aligns with your lifestyle. Whether it's the laid-back beach vibes of Encinitas, the picturesque charm of Carlsbad, or the upscale coastal living of Del Mar, I'm here to guide you towards the community that feels like home, keeping your health and well-being in mind every step of the way.
With my background in health and wellness, I recognize that our housing and community needs evolve through different chapters of our lives. From first-time buyer to seasoned investor, downsizing, retirement, probate, or foreclosure, I am committed to being a resource for you at every stage. I believe that a home is more than just a place to live – it's a reflection of the community and life around it.
Let's find the perfect home that not only meets your needs but also complements the healthy and active lifestyle you desire.
Get in touch with me today, and let's start building your dream lifestyle in the community you love!
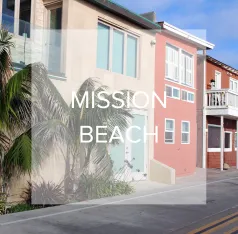
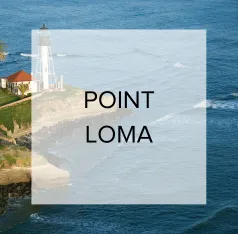
Explore Some of San Diego's
Coastal Communities:


I Work In Collaboration With Canter Companies
To Help My Clients With:

Property Management
Iconic Property Management
We specialize in managing luxury homes, apartment complexes, HOAs, commercial & mixed-use properties in San Diego.

Vacation Rentals
NXT Vacation Management
Premium vacation rentals and management services in San Diego's most sought-after destinations

Pest Control
Talos Pest Control
Elevating Your Home's Defense- Comprehensive pest management solutions for San Diego County

Wealth Management
Canter Wealth
Your financial journey has many moving parts. What matters most is how they all work together to help you achieve your life goals
Main Office: 7863 Girard Ave
Secondary Address: 2033 San Elijo Ave 111
Call 760-557-0760
Email: [email protected]

ALL Right Reserved|Copyright 2024| Agent CA DRE 02117957
Compass is a licensed real estate broker DRE 01527365 in the State of California and abides by Equal Housing Opportunity laws. All material presented herein is intended for informational purposes only. Information is compiled from sources deemed reliable but is subject to errors, omissions, changes in price, condition, sale, or withdrawal without notice. No statement is made as to accuracy of any description. All measurements and square footages are approximate. This is not intended to solicit property already listed. Nothing herein shall be construed as legal, accounting, or other professional advice outside the realm of real estate brokerage.
Facebook
Instagram
LinkedIn